How to Supercharge KPIs and Metrics

As many equipment-intensive companies grow, the ability to prioritize operational needs while providing a return on investment becomes increasingly complex. Balancing organizational needs to generate bottom-line profit while maintaining agility in the field is no small task. Smaller organizations often rely on the intuition or “gut feel” of trusted employees, while larger organizations rely on process with metrics or KPIs to guide their actions.
One limitation with most metrics and KPIs in use today is that they typically report on one thing, such as downtime, utilization, or return on capital employed (ROCE). Additionally, these metrics tend to be department-specific: Downtime is the responsibility of maintenance, utilization belongs to operations, ROCE is managed by finance/accounting. Few metrics and KPIs cross these invisible organizational walls to inter-relate and combine data, resulting in metrics and KPIs that become stale and irrelevant over time.
Despite the vast number of metrics available, many organizations still struggle to demonstrate to owners, investors, and shareholders how their return on investment in construction equipment is being maximized. This age-old issue arises again and again simply because traditional metrics lack the holistic view needed to provide insights that reflect the overall performance and capital efficiency of the organization.
How some equipment metrics fall short
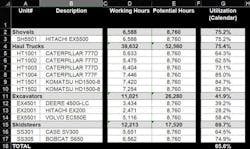
Let’s look at an example using utilization to illustrate how some metrics can become stale. In the nearby table is a list of assets (column B), their respective Working Hours (column D) and their Potential Hours (column E). The Utilization rate (column G) is calculated by dividing the Working Hours by Calendar Hours. Utilization rates range from 28% to 85%. Although some usage trends can be noted across the classes of equipment (for example, by size of haul truck), over the course of time these metrics and reports lose their benefit. To understand why that is, let’s look at two specific assets from this list.
Row 3 shows a Hitachi EX5500 shovel with 75.2% utilization, and Row 17 a Bobcat S650 skid steer with 74.9% utilization. The utilization rate is good information to see how the individual assets are being used. When a senior leader or investor looks at the data, however, and sees virtually the same values and knows that one asset is a $9 million shovel and the other a $55,000 skid steer, these metrics are not enough to illustrate if the capital investment is being maximized.
To address these challenges, it is crucial to develop metrics that integrate data across departments and reflect the true value and utilization of assets. Many investors already follow the stock market to monitor the value of their stocks. Recognizing this, let’s look to the stock market for a way to find a metric.
Savvy investors navigate this sea of values using a method called Capital Weighting. Capital weighting is used to make sense of the stock market. Instead of treating all companies equally, it assigns more importance to bigger companies based on their total market value. This means a company with a $1 billion value will have a larger influence on the index than a company with a $1 million value.
Translating this to equipment, do we want metrics to flag a skid steer the same way that a shovel or haul truck is flagged? The short-answer is “No,” so let’s see if we can use capital weighting to supercharge or “level-up” an operational metric that already exists and is widely understood. In order to obtain capital weighting, we first need to choose a value that is not arbitrary; it must be understandable and readily available so that the results are clear, repeatable, and widely understood.
The easiest value to use is the capital value of the asset itself. Do not confuse capital value with book value. Although it may seem easy or make sense to use these more readily available values from accounting, any assets that are fully depreciated or depreciated below market value will not receive weighting that reflects the true capital value of the asset. Shareholders and investors as well as “switched-on” owners expect a return based on the true capital value, not the book value.
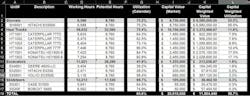
Let’s see what happens to the same data set from the example above when we layer in Capital Value (column I). To calculate the Capital Weighted Value (column K), multiply the capital value for each asset from column I by the utilization rate in column G. For example, in row 3, $8.75 million multiplied by 75.2% equals $6.58 million. Adding these calculations for each asset in column K results in a total value of $11.864 million. This $11.864 million represents the sum of all the capital-weighted values, which is a measure of the total capital-adjusted utilization across all assets.
Last, we need to calculate the Capital Weighted Utilization (column L) for each asset by dividing the capital weighted value from column K by the Total Capital Weighted Value in cell K18. Using row 3 data, divide $6.58 million by $11.864 million to arrive at a capital-weighted utilization rate of 55.5%.
More asset management
- COSTS: Mike Vorster says know the difference between cumulative cost and marginal cost when considering replacements.
- RELIABILITY: Mike Brennan, CEM, says renew the attack on uscheduled failures.
- UTILIZATION: Mike Vorster applies a financial-investment strategy to equipment fleet assets.
- REPLACEMENT: Craig Gramlich, CEM, defines the the window of opportunity at replacement decisions.
- ORGANIZATION: Mike Brennan, CEM, shows how AI can improve processes for specification requirements.
Now when we compare the Hitachi EX5500 shovel and the Bobcat S650 skid steer—which previously showed utilization rates of 75.2% and 74.9%, respectively—we see a capital-weighted utilization rate of 55.5% and 0.3%, respectively.
By considering both the capital value of each piece of equipment and its utilization rate, the new metric in column L provides valuable insights into how effectively an organization is utilizing its investment in equipment. Utilization values are scaled up or down based on the capital investment, illustrating each asset’s contribution to the overall use of capital. Simply put, the capital-weighted utilization is a measure of how effectively capital investment dollars in each asset is utilized relative to the capital investment across all assets. While the standard utilization calculation will show use of the asset itself, the capital-weighted utilization calculation will show the effective use of the capital employed. This new metric allows decision-makers to pinpoint and prioritize where to place the capital monies if or when capital expenditures become tight and identify which categories or classes of equipment are contenders for making the strategic rent vs. own decision.
Achieving a high capital-weighted utilization requires careful management of both equipment utilization rates and capital investments. Construction companies must strive to ensure that each piece of equipment is utilized to its full potential, avoiding downtime and underutilization wherever possible. At the same time, they must balance this goal with the need to manage capital expenditures effectively, avoiding overinvestment in equipment that may not be fully utilized or generate as much of a return as other types of equipment.
This concept of capital weighting can also be applied to organizational metrics and frameworks and works wonders to allocate costs more effectively. More specifically, it can be applied to shop overhead allocation and resource prioritization, guiding the management of inventory by prioritizing stock levels and reorder points for parts and supplies critical to high-value equipment.
Capital weighting can be a critical tool for organizations to “level-up” their financial performance and operational efficiency.
About the Author

Craig Gramlich
Craig has extensive experience in equipment management across transportation, heavy lifting, civil projects, mining, and construction sectors. Driven by a passion for cost and data analysis, he excels in enhancing equipment accounting, rate modeling, and developing programs for rate escalation and transfer pricing.
Through Lonewolf Consulting, Craig effectively unites Equipment, Operations, and Accounting departments, leveraging his extensive field experience to help companies streamline operations and find cost savings, significantly boosting ROI.
He holds a Bachelor of Commerce from the University of Alberta and a Certified Equipment Manager (CEM) certification, along with a variety of professional development courses, showcasing his commitment to ongoing professional growth.