How to use cost history to determine remaining life
In a recent column, "Extending the Sweet Spot on Machine Life," we introduced the “window of opportunity” as a way to look at extending the useful life of an asset. This month, we look at a real-life example: the battle of old vs. new or—depending on your capex policies—the battle of fully depreciated vs. fully valued.
Our example features two contenders in a boxing match of sorts. The defender is a tried and true, revenue-generating excavator weighing in at 80 tons with an original purchase price of $1.0 million, a sweet spot hourly rate of $134.09, and a record of 8 years or 17,000 hours.
The challenger is a shiny new excavator that is touted as being 12 percent cheaper to operate, repair, and maintain. It also weighs in at 80 tons with a purchase price of $1.15 million and a sweet spot hourly rate of $141.75. It’s record: 0 years, 0 hours.
Remember that this is a replacement decision, so let’s focus on the facts. Judges (aka decision makers), to prepare for this contest, review Section 10-2 of Mike Vorster’s Equipment Economics V2, which identifies three things to look for:
- Review the cost history of the Defender for its actual costs to date and use this data to put together a reasonable projection of the marginal costs expected for continuing to use this machine (One to three years of cost projection is usually enough, just be considerate of the fact this machine can have a costly component rebuild or replacement come up soon.)
- Identify and analyze Challenger(s), and do a lifecycle or sweet-spot cost projection.
- Pinpoint the moment in time when the marginal cost for your Defender is no longer lower than the minimum cost of the Challenger.
Contenders, touch buckets and let’s begin.
Round 1
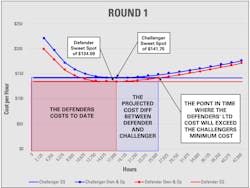
The Defender comes out swinging by showing its sweet-spot rate is $7.66 lower per hour ($141.75 - $134.09) than the Challenger. Why not keep operating it until its life-to-date (LTD) costs exceed its sweet-spot?
As the first round comes to an end, the Defender raises its bucket like a champion because it believes it will not reach a cost per hour of $141.75 until it surpasses 26,000 hours in another 4.5 years.
But wait. The referee is shaking his head and heads over to talk with the judges. It appears we have an illegal move by the Defender, and the first round must be stricken from the judges’ scorecards. As we wait for Round 2, let’s explain what just took place. Although this type of rate analysis is used to compare alternatives, it assumes the units are at the same point in their economic lives, that is, 0 hours. In this instance, the results are skewed by moving the replacement decision further to the right than it should be because the escalating costs are blended down by the lower LTD costs. It also ignores the time-value of money that has taken place since the Defender was purchased 8 years ago.
This replacement decision isn’t about what you’ve already spent, it’s about what you’re going to spend. So long as your business isn’t planning to cease operations anytime soon, all monies spent yesterday must be treated as a "Sunk Cost." Only the money spent today and tomorrow matter for this decision.
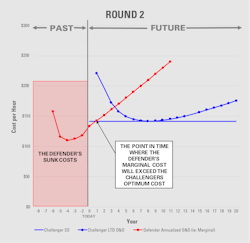
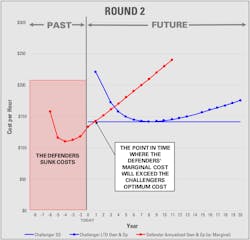
The good news is we have all the data needed to help the judges make their decision; it just has to be packaged and looked at a little bit differently. Let’s expand on the judging criteria mentioned earlier. First, align the contenders onto the same time period: today equals 0. Next, use only the annualized costs for the Defender, that is, some measure of marginal costs. (Note: The historical costs for the Defender are only needed to estimate these future costs and need to be otherwise ignored.) Plot these annualized costs per hour for the Defender (red line) with the optimum costs per hour for the Challenger (blue lines). Pinpoint the moment in time when these annualized costs per hour (marginal costs) exceed the optimum cost per hour of the Challenger.
Round 2
The round opens with the Defender upset that its escalating parts costs cannot be blended down with its life-to-date costs. The Challenger throws down by showing the Defender’s sunk costs plus the point in time the annualized costs (marginal costs) of the Defender will exceed the Challenger’s optimum. The judges see this will occur in just under 1.5 years. The Defender can’t accept that its remaining life is only 1.5 years when in Round 1 it was convinced the data showed its remaining life to be 4.5 years. The Defender feels air in its fuel line and its engine sputters to a halt just as the bell rings ending Round 2.
Before Round 3 is set to begin, the Defender’s mechanic overhears the judges discussing whether the numbers presented in Round 2 were factored for any sort of productivity or downtime that would also occur with the lower reliability or obsolescence from the Defender. The mechanic finds a loose fuel fitting and lets the foreman know their last fuel filter was just put on the machine. The shop foreman is now concerned about the Defenders’ ability to finish today’s battle and be ready for the job site tomorrow. He has a decision to make.
Round 3
The Defender fires up with a cloud of black smoke as it burns off the diesel that had accumulated in the cylinders from re-priming the fuel system. At the same time, the foreman is standing in the corner waving their arms and throwing in the shop towel.
Judges' decision
Scoring this contest will depend exclusively on the decision-making criteria. For some companies that have a backlog of work and a need for reliability, the Challenger would be a better choice. For others, the Defender would be the suitable option because they expect a lull between jobs, have a higher tolerance for breakdowns, or are planning to cease operations.
It i’s best for decision-makers to seek clarity early. This will help the equipment manager know what’’s most important and what information the business needs to properly evaluate this replacement decision. Without this clarity, don’t be surprised when replacement decisions tend to be a "let’s wait and see" exercise, and then a costly repair or failure occurs. Predicting end-of-life failures only helps to manage the risk; the only way to eliminate the risk is to dispose of or replace that machine before the costly repair hits the bottom line.
Understand first that there is a “Window of Opportunity,” which is the fleeting moment in time when a unit must be closely monitored as it approaches its sweet spot or end-of-life target to reduce the risk of failure and unplanned costs. Second, while closely monitoring end-of-life units, begin evaluating Challengers so the moment in time can be pinpointed when it is more economical for the business to replace the Defender than to keep it.
Making replacement decisions can be a complicated and emotional process, but by focusing on the facts and analyzing the data objectively, decision-makers will navigate this sea of uncertainty to make the best choice for their company’s needs.
About the Author

Craig Gramlich
Craig has extensive experience in equipment management across transportation, heavy lifting, civil projects, mining, and construction sectors. Driven by a passion for cost and data analysis, he excels in enhancing equipment accounting, rate modeling, and developing programs for rate escalation and transfer pricing.
Through Lonewolf Consulting, Craig effectively unites Equipment, Operations, and Accounting departments, leveraging his extensive field experience to help companies streamline operations and find cost savings, significantly boosting ROI.
He holds a Bachelor of Commerce from the University of Alberta and a Certified Equipment Manager (CEM) certification, along with a variety of professional development courses, showcasing his commitment to ongoing professional growth.


