Equipment managers must often identify future staffing and facility needs in response to changes in organizational structure, direction, and contract volume that alter the overall size, composition, and maintenance requirements of the fleet. By calculating the maintenance repair factor (MRF) and subsequent asset equivalents (units) of each specific asset class, equipment managers can forecast the changing maintenance requirement of the fleet to match technician staffing and facility requirements to future operational requirements.
To accomplish this, we must categorize the equipment assets into specific types and classes, then extract specific data from the maintenance-management system to formulate MRF and calculated asset equivalents. With these, we can develop actionable data with which to maintain efficiency within the maintenance team.
For more asset management, visit ConstructionEquipment.com/Institute.
By identifying the various types of assets and their roles, we can understand their inter-relationship in the organization and gain insight on how best to support the maintenance requirement of the fleet. Although equipment classifications may vary according to an organization’s primary mission, they generally look like this:
100 - Primary or critical equipment: Without this equipment, operations would be forced into a shutdown or a significant reduction in job-site performance. Examples include haul trucks, mass excavators, dozers, loaders, compactors, cranes, and paving equipment.
200 - Secondary or associated equipment: Examples of these include water trucks, fuel trucks, backhoe loaders, skid steer loaders, mini excavators, pumps, generators, light towers, and aerial work platforms.
300 - Administrative or support equipment: Here we would find pickup trucks, crew trucks, survey trucks, and service trucks.
400 - Miscellaneous equipment: site transport and work carts, attachments, and small engine and seasonal equipment.
500 - Advanced technology: Equipment of a highly technological nature, such as drones, site-specific GPS, and terrain-measuring equipment.
Proper coding is important so we can manipulate the maintenance data contained in asset-management systems. Data can be imported and arranged into a customized report or spreadsheet for quick calculations. These data represent the technician and facility requirements of the fleet as completed through in-house maintenance services. Field service, outsourced service, and other exceptions should be accounted for separately.
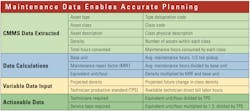
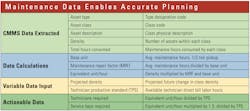
The table below shows the process.
Asset type, class, description, class density, and class labor hours consumed are required data extracts (light green in the table). The technician production standard for the organization is required and manually input as well as projected changes in fleet density. Calculative formulas are applied to data in specific columns, which ultimately identify the number of technicians and service facility space required for each type and class. Such data should be arranged by asset type, beginning with the primary/critical equipment and moving through the various asset types to easily summarize and create a better understanding of the requirements of each asset type.
Two variable data inputs (yellow) are required to validate projected technician staffing and facility size requirements.
First, changes in class density affect the class overall maintenance effort and are required to be manually input for each specific class. The equivalency calculation will change, identifying the future or projected maintenance requirement. Once completed for all classes, the projected maintenance effort will have been identified and available as actionable data.
Second, the technician production standard (TPS) is the annual average billable hours available of a journeyman-level technician. This includes all time spent performing preventive maintenance, equipment diagnostic time, performing the repairs required, field service, equipment mobilization and assembly as well as decommissioning of the equipment. Paid time off and indirect hours are not included in this value.
Three primary data calculations (in blue) are required in developing the actionable data required to validate technician staffing and facility size for the fleet and asset type.
The base unit is the median annual labor effort required to maintain an administrative service type asset, normally a 1/2-ton pickup truck. This number carries an equivalent unit value of 1 and becomes the foundation for comparison of classes, development of the maintenance repair factor, and equivalency calculations.
The MRF identifies the degree of difficulty between the various types and classes. It is the median annual labor effort of each specific asset class divided by the base unit median value. If the pickup truck has a median labor requirement of 10 equivalent unit/hours and a value of 1, and a 40-ton haul truck has a median labor requirement of 158 hours, then the equivalent unit/hour value of the haul truck is 16, meaning it requires 16 times the maintenance effort (158 divided by 10). Once completed for all asset classes, it identifies the class value required for the equivalent unit/hour calculation.
The equivalent unit/hour calculation identifies the total maintenance effort required for each specific class, and when totaled the maintenance requirement of the fleet. It is derived by multiplying class density by the maintenance repair factor and base unit median value. The total of all classes becomes the current total maintenance requirement of the fleet. To project future maintenance requirements, input of projected changes in class density will identify the variance in each specific class and overall maintenance requirement.
We now convert the calculated values to actionable data (in green).
To identify total technician staffing requirements, divide the total equivalent unit/hours by the TPS. Making this calculation by asset type further identifies technician requirements for specific asset types.
To identify facility requirements, multiply the equivalent unit/hours by 1.3, then divide that value by the TPS. The value of 1.3 compensates for parts delivery delays of unscheduled repair work once the asset has entered the service bay, assuming a scheduled versus unscheduled workload of 50:50. Making this calculation by asset type identifies number and size of service bays required by the specific asset types.
Current maintenance requirements are represented by the total hours consumed. Future maintenance requirements are represented in the equivalent unit/hour total. Staffing-level changes are now validated, as well as the required maintenance facility area.
The cumulative information derived becomes invaluable information providing both a holistic and detailed review of the fleet to quickly validate current and future maintenance technician and service facility requirements by type, facility, and overall organization.


