Previously, we introduced lifecycle cost as a subject that many people talk about but few people really understand. We devoted Part I to two things: the calculation of the hourly operating cost for an example machine and the calculation of hourly owning cost for the same machine based on the purchase price and a set of defined policy assumptions regarding depreciation and book value. We added the hourly owning and operating cost together to show that there was an optimum lifecycle cost.
We will pick up where we left off and devote this article to an owning-cost-per-hour calculation based on a set of assumptions regarding residual market value and a discussion of fact that you cannot optimize lifecycle cost unless you also optimize the life-cycle period.
There are two schools of thought when it comes to estimating owning cost per hour. Some companies base their calculations on a set of depreciation assumptions and use accounting depreciation as the basis for their calculation. These depreciation charges and any other owning costs can be calculated while doing the rate calculation as we did in the previous article, or they can be imported from the accounting software to ensure that everything ties up exactly. It makes little difference in the end, but it is always a good thing to ensure that material differences can be quickly and easily reconciled.
Other companies believe that market depreciation should be the basis for estimating hourly owning cost and use their best estimate of the residual market value to calculate the hourly owning cost. This approach is a little more complex and requires two things. First, you need a reasonably accurate formula that shows how residual market values change with the life of the machine. Second, you need to know the selling price of a couple of used units so that you can calibrate your formula and ensure that it replicates actual values as closely as possible.
The nearby standard formula for estimating residual market value (RMV) is based on the age of the machine in hours worked (H), an RMV Total factor (K), and an RMV Shape factor (C). The formula is relatively simple, but it works well because the two factors enable you to calibrate or adjust the formula so that it replicates the actual values recorded in the used equipment market for a particular unit at a particular time. The Total factor, K, can vary from a fairly optimistic 0.8 to a conservative 0.5. The Shape factor, C, can vary from a “standard” value of negative 0.5 to an aggressive (low RMV) value of negative 0.8. The smaller the values of K, the lower the RMV percentage. The larger the negative value of C, the more aggressively the value of the machine is written off over time.
The hourly-owning-cost-life-to-date calculation is given in the table below, with cost inputs in the inset. The example uses a conservative value of 0.5 for K and a “standard” value of negative 0.5 for C.
Column A is the year of ownership, column B shows the actual hours worked in the year, and column C accumulates those hours life to date (LTD). We have kept the machine for eight years, and it has worked a total of 12,750 hours. The formula, the two RMV factors, and the values in column C are used to calculate the estimated residual market value percentages given in column D.
Column E gives the loss in RMV for a particular year. This is calculated by determining the annual decrease in the value of the RMV% given in column D and multiplying this by the original purchase price. (In year 2, RMV% went down from 36.3 percent to 25.8 percent. The decrease for the year is 10.5 points, which equates to a loss in RMV of $10,505 as shown in column E. In year 4, RMV% went down from 21.5 percent to 18.6 percent. The decrease for the year is 2.9 points which equates to a loss in RMV for the year of $2,855 as shown in column E.)
Column F shows the additional $2,000 per year annual owning costs, which are added to column E to give the total annual owning costs in column G. Column H accumulates these for LTD total annual owning costs. Column I is column H divided by column C for the annual owning costs per hour, LTD.
Column J adds in the $2 additional hourly owning costs to give column K, the estimated owning cost per hour LTD.
Column L is the operating cost per hour as calculated in the previous article. Column M is column K plus column L and gives the estimated owning and operating cost per hour life to date.
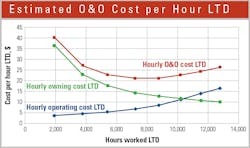
The last three columns (K, L, and M) are plotted in the graph at the top.
The blue line is hourly operating cost LTD, and it goes up as the machine ages and costs more in repair parts and labor. The green line is hourly owning cost LTD, and it goes down as the machine ages and accumulates more hours over which to depreciate the original purchase price. The red line plots column M, the sum of hourly owning and hourly operating costs. It is high early because of the high owning costs, it makes a minimum around 8,000 hours, and then increases again because of the high operating costs.
It is essential to understand that the cost per hour shown on the graph is an average cost per hour, life to date. In other words, if we had kept the machine three years or 5,420 hours, then the average cost per hour for that three-year period would have been $22.86. If we had kept it five years or 8,752 hours, then the average cost per hour for that 8,752-hour period would have been $21.24. We have kept the machine for eight years, and it has worked 12,750 hours. The average cost per hour for the total eight-year ownership period comes to $26.22.
This is the lesson to be learned: You can calculate lifecycle cost per hour. Add up all the money you think you will spend during the life cycle and divide the total by the number of hours you think you will work during the life cycle. But you cannot calculate minimum lifecycle cost per hour, and you cannot optimize lifecycle costs unless you also calculate the optimum life-cycle period. Our example has clearly shown that there was a time when lifecycle cost divided by lifecycle hours reached a minimum: four years or 7,200 hours at which time the life cycle cost reached an optimum of $21.09 per hour.
You cannot talk about optimum lifecycle cost without talking about optimum life-cycle period. Above all, you cannot estimate one without estimating the other.
For more asset management, visit ConstructionEquipment.com/Institute.


