Budgets Limping Along
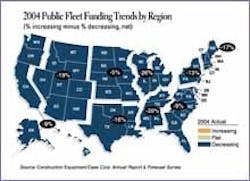
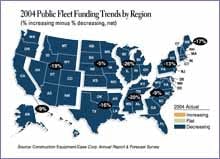
Look no further than the blue map at the right to see that government fleets experienced a second straight year of funding decreases in 2004. For some regions, it was the third year in a row that money has dried up.
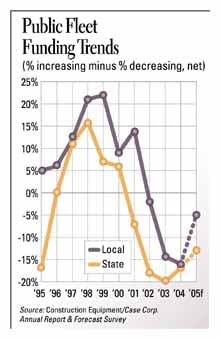
The positive side, if it can be called such, is that the net (the percent reporting increases minus the percent reporting decreases) was slightly higher for local fleets than forecast for the year. Among local fleets, 17 percent reported funding increases minus 33 percent reporting decreases for a net of -16. On the state side, 20 percent reported increases minus 37 percent decreases for a net of -17.
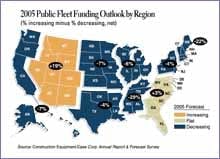
This year is forecast to be better, with the nets for both state and local fleets inching up, although they remain in negative territory. Local fleets are more positive, as 22 percent report increases against 27 percent decreases for a net of -5. States forecast a net of -13 for this year, with 25 percent predicting increases minus 38 percent decreases.
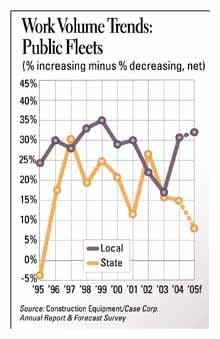
Work volume doesn't slow as funding decreases, however. Among local fleets, 38 percent reported volume increases minus 7 percent reporting decreases for a net of 31. States were a bit slower, with 27 percent increases minus 12 percent decreases netting out at 15. Six out of 10 government fleets expect 2005 work volume to stay at 2004 levels.
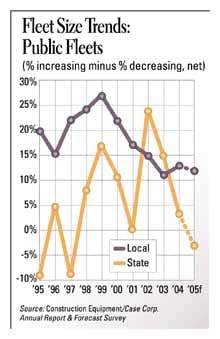
States have responded to funding shortfalls by curbing their fleet-expansion plans. Nearly three-fourths of state fleets did not change the number of machines in their fleets last year; two-thirds expect to do the same this year. Local fleets report similar numbers, although among those who will be changing fleet size, more will be increasing than decreasing, for a net of 13. States report a net of 3.
Yet replacement rates are higher for state fleets, suggesting a more ready willingness to turnover under-performing machines. Governments replaced at the rates forecast last year, but they differ in their forecasts for 2005. States project a boost in the rate to 10.3 percent from 2004's rate of 8.3 percent; locals project a decline to 6 percent from last year's 6.3 percent.
Fewer than half of governments say their fleets are in "excellent" or "very good" condition, and 15 percent say fleets are "fair" or "poor." One of 10 state fleets reported such conditions; 15 percent of locals did.
Rental continues strong as an acquisition strategy among government fleets, with 58 percent using short-term rental. One-third of state fleets and one-fifth of local fleets increased their use of short-term rental last year in terms of total rental machine hours.
Light earthmoving equipment remains at the No. 1 spot for type of equipment rented for both government types. States then list air compressors/gen sets, heavy earthmoving equipment, compaction and work platforms. After light earthmoving, locals rent light equipment, compaction and heavy earthmoving.
Short-term rental is used by 11 percent of government agencies as a means of acquiring major machines, defined as more than $25,000 in price. Governments, of course, still rely most on outright purchase, with 83 percent citing this method. Others, in order, are lease/purchase (13 percent), financed purchases (12 percent), rental/purchase (6 percent), and leasing (3 percent).
Workforce changes remain consistent with past years, with about 60 percent of government fleets keeping overall levels the same. In a sign that fleet service and maintenance remain priorities, 75 percent of locals reported that this workforce has stayed the same, with an additional 9 percent reporting an increase in personnel. Among states, 63 percent reported stability in the workforce and 10 percent reported increasing the number of workers in service and maintenance.
