Government Construction Equipment Fleets Crunched by Budgets
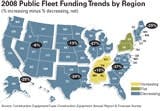
Public fleet funding, overall, has more managers citing shrinking budgets than expanding. One region does not, however, as the Mid-South has more managers who experienced larger funding pies last year than those who saw decreased funding.
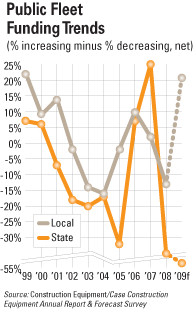
The percentage of state fleets seeing funding cuts far outstripped those with increases, with local fleets reporting a slightly less negative net. Both fleet outlooks grow worse for 2009, although the state fleet forecast is twice as dire.
States replaced fleet at a higher rate than locals last year, but still less than expected. For 2009, local fleets anticipate a rate comparable to last year; state fleets will reduce their replacements.
Fleet funding fell last year for our nation’s publically owned fleets. Despite a respite in 2006 and 2007, both state and local fleets reported a net decrease in funding for 2008.
State equipment fleets suffered most: 51 percent reported a decline in funding and only 16 percent reported an increase for a net of -35 percent. On the local side 36 percent said funding decreased in 2008 and 23 percent said it increased, leaving a net of -13 percent. These net percentages compared to 25 percent and 2 percent, respectively, in 2007. More significant, 2008 actuals came in below the forecast, which was 18 percent net for state fleets and 7 percent for local.
Forecasts for 2009 go further south, with state fleets leading the way. Their predictions are dire. About seven in 10 say funding will decrease this year compared to 2008, and 14 percent say it will increase. That gives state fleets a net of -52 percent. Local fleets show a similar downward trend, although not nearly as drastic. Local fleets record a net of -21 percent, with 39 percent estimating that funding will decrease and 18 percent saying it will grow.
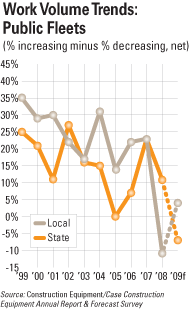
More state fleets also reported a decrease in 2008 work volume as compared to 2007. Measured in machine hours, work volume was less for 24 percent of state fleets and more for 13 percent, leaving a net of -11 percent. Local fleets were just the opposite, with a net of 11 percent, a sum derived by subtracting the 14 percent reporting less volume from the 25 percent reporting more. Forecasted work volume will increase for 19 percent of state fleets and 22 percent of locals, respectively, and decrease for 26 percent and 18 percent. The state fleet net for 2009 volume compared to 2008 is -7 percent; local fleets net out at 4 percent.
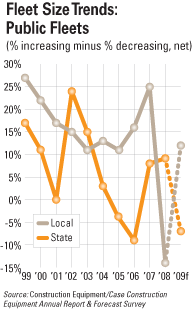
Local fleets grew in 2008, measured in number of machines, continuing a trend that’s lasted for more than a decade. About two in 10 local fleets expanded in 2008 compared to 2007, and 7 percent contracted for a net of 14 percent. On the state side, 24 percent reported decreased fleet size and 15 percent increased for a net of -9 percent. State net stays negative for this year, at -7 percent, with 14 percent forecasting an increase minus 21 percent forecasting a decrease. Local fleets data indicate 13 percent reporting an increase in fleet size this year minus 11 percent who see a decrease, for a net of 2 percent.
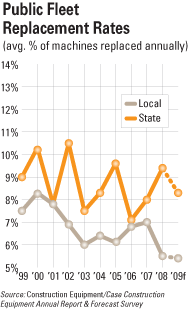
Replacement rates increased for state fleets in 2008, to 9.5 percent compared to 8 percent in 2007. State fleets anticipate a smaller rate of replacement this year, though, down to a forecast of 8.3 percent. Local fleets reported a rate of 5.5 percent in 2008, down from 7 percent in 2007. They will hold that rate in 2009, they predict, with an estimate of 5.4 percent.
Government fleet condition slipped slightly from 2007, when 49 percent said their fleets were in “excellent” or “very good” shape. Last year, 47 percent reported fleets in such shape. On the other end of the sprectrum, 14 percent of government fleets are in either “fair” or “poor” condition.
Historically, government fleets use outright purchase to acquire machines values at more than $25,000. Last year was no exception with 81 percent indicating this acquisition strategy. Government fleet managers increased their use of short-term rental for major machines last year, with the percentage of respondents increasing from 13 percent in 2007 to 22 percent in 2008. For machines of any cost, equipment managers have stayed consistent in the use of short-term rental compared to 2007. Six of 10 reported using short-term rental in 2008, compared to 58 percent the year before.
