Follow the Money, Part 2
Last month we discussed the need to know how equipment-related transactions flow through the organization and detailed a process for operating costs. We introduced a diagram of how charges flow from the job accounts to the equipment account.
This article details a process for owning costs and concludes our discussion on the diagram by looking at it as an integrated whole.
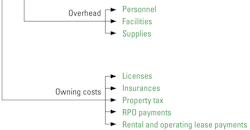
There are two parts to what is typically defined as owning costs. First are the costs themselves, shown in green in the diagram. Money flows out of the business in real, or “green,” dollars. The second are the charges levied to cover the depreciation and interest charges on capitalized assets. These are shown in blue in the diagram because we use internal, or “blue,” money. Not all owning costs are true costs. They are, in fact, a mixture of costs—where we pay for something we receive—and charges—internal transactions needed to keep our books of account in order.
Note that true owning costs, the green transactions, come in two families. First are those that have to do with compliance. These include licenses, insurances, property taxes, and the like. Some companies carry the costs as a single line item in the equipment account, others allocate costs to individual units using metrics such as book or replacement value. Still others bill every transaction to every individual unit in the fleet. Regardless, it is an administrative process with few risks.
The other family of costs cover payments on rental, rental with purchase option (RPO), and operating lease agreements. These are payments made to rental or leasing companies for machines that we do not own but have the right to use for a given period under given circumstances. The units are not included among our capitalized assets, and therefore we do not have the ability or the need to depreciate them. We make predetermined time-certain payments, and our risk lies in achieving the utilization required to meet the fixed payments.
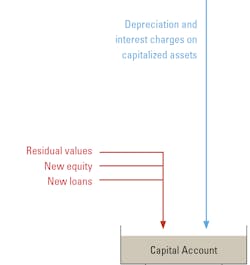
The tricky and controversial portion of the owning-cost side of the diagram starts when we look at the depreciation and interest charges we levy to write down our own capitalized assets and ensure that book values remain reasonably in line with market values. This involves depreciation, depreciation rates, and depreciation charges. It is a complex subject, but our diagram helps us to understand how the two blue arrows work together to (a) generate internal charges that bill the jobs for the equipment they use, and (b) take a portion of these charges from the equipment account to the capital account shown in the lower left of the diagram.
The capital account is where we account for and balance all the transactions relating to our capitalized assets. There are two inflows: the blue depreciation and interest charges that flow out of our equipment account, and funds from the sale of capitalized assets, new equity investments in the fleet, and new loans raised to finance the purchase of equipment as shown in red. Capital expenditures flow out of this account, and include payments on financed assets, capital lease payments, and cash payments on new machines. The diagram shows that there is, or should be, a return on owners’ equity flowing out of the account as shown in black.
The manner in which transactions flow through an organization is complex. The costs involved, as shown by the green outflows on the right, are many and extraordinarily risky. The only inflows are the few red arrows: payments we receive from our clients, returns when we sell capitalized assets, what money we borrow, and what owners want to invest in the fleet.
The gain from the system is the return on the owners’ equity; it justifies the enterprise. It is a long, risky, and complex journey to get from the top to the bottom. This diagram should help each organization develop the map showing the route.
More on asset management.


